


Mineral Fertilizers
Nitrogen fertilizers
Two types of nitrogen fertilizer are commonly used in West Africa: urea containing 46% N and ammonium sulfate containing 20–21% N. Complex fertilizers used for phosphorus fertilization (such as di-ammonimum phosphate, containing 18% N and 46% P2O5) also sometimes contain N (see under phosphate fertilizers). For nitrogen fertilization, urea is the best type of fertilizer to use. It is not advisable to use fertilizer-containing nitrate (NO3-) as a source of nitrogen, because nitrate is easily leached to the bottom of the profile, out of reach of the rice roots.
Example: a bag of 50 kg of urea contains 50 ´ 0.46 = 23 kg N.
Phosphorus fertilizers
Phosphorus can be applied as rock-phosphate or as mineral fertilizer. Phosphorus application has to be supported by N application. Red soils contain significant amounts of iron oxide. These oxides form a complex with P and fix P so that it is not available to the crop. With such soils, farmers will have to use very large quantities of phosphorus fertilizer for some to be available for the plants.
Single super phosphate (containing 18% of P2O5) and triple super phosphate (TSP) (containing 46% of P2O5) can be used. However, di-ammonium phosphate (DAP) or 18-46-0, containing 46% of P2O5, is also available.
Examples: one 50-kg bag of TSP contains 50 ´ 0.46 = 23 kg P2O5, or 23 ´ ((2´31)/(2´31+5´16)) = 10 kg of P. (In this calculation, 16 is the atomic weight of O and 31 the atomic weight of P.) A 50-kg bag of DAP contains 50 ´ 0.18 = 9 kg N and 50 ´ 0.46 = 23 kg P2O5, or 10 kg of P.
Potassium fertilizer
Potassium sulfate and potassium chloride are the potassium fertilizers used in Sub-Saharan Africa. Nowadays, few farmers still use them, particularly when crop residues remain in the field. Potassium is mainly found in compound fertilizers, such as 10-20-20.
Example: a 50-kg bag of 10-20-20 contains 50 ´ 0.2 = 10 kg of K2O or 10 ´ (2´39/(2´39+16)) = 8.3 kg of K. (In this calculation 39 is the atomic weight of K and 16 is the atomic weight of O.)
Organic amendments
An interesting option is the introduction of legumes into a crop production system. Legumes are often cultivated in rotation with cereals and are incorporated into the soil when they are still green. In the lowlands, this can be done during the dry season following wet-season rice. The advantage of green manure is that it increases the N content, improves the soil structure and increases the organic-matter content. They also often increase P availability in the soil. Mucuna pruriens is a rapidly growing legume, it suppresses weeds and can fix up to 60 kg N/ha per year. Other legumes, such as Sesbania rostrata, Sesbania sesban, Tephrosia vogelii and Crotalaria spp., have an N-fixing capacity of 10 to 50 kg N/ha. The N content of this green manure is between 2 and 4.3%. The N content of animal manure is extremely variable and mostly depends on the storage method. In general, the N content is rather low and does not exceed 0.5 to 1%.
The incorporation of crop residues will not always increase N availability. This is often the case when these residues, e.g. rice straw, have a poor N content as compared to their C content. The micro-organisms in the soil fix nitrogen to decompose the residues with large C/N ratios, which means that there is less N available for the plants in the short term. Rice straw is, however, an important source of K (straw has a K content of about 1.5%).
Compost is a mixture of partially decomposed plant material, such as weed and rice straw. Nitrogen content of compost is often between 0.3 and 0.9%.
When comparing the N contents of organic and mineral fertilizers, it is evident that high quantities of organic fertilizer are required to apply 30 or 40 kg N/ha. However, applying both mineral fertilizer and organic amendments often results in synergic effects, increasing soil nutrient-supplying capacity in the long term, and sometimes even the recovery rate of nutrients applied with mineral fertilizers.
Site-specific integrated soil-fertility management
Integrated soil-fertility management aims at the optimal and sustainable use of nutrient stocks from the soil, mineral fertilizers and organic amendments. A procedure is given below for calculating fertilizer needs to reach target yields as a function of the soil nutrient-supplying capacity and potential yield.
Three steps are necessary:
· Fix a target yield
· Estimate the capacity of the soil to supply N, P and K
· Calculate fertilizer requirements.
Fixing a yield target
The potential or maximum yield of a crop (Ymax) is determined by the climate (minimum and maximum temperatures and solar radiation), sowing date and the characteristics of the variety chosen by the producer. For a given sowing date, Ymax is not constant but fluctuates from year to year because of climatic variability. It is evident that the producer cannot change the weather, but he/she can choose a sowing date that will allow him or her to exploit the weather conditions more productively and to choose a variety adapted to these conditions. Ymax can be obtained on experimental plots conducted under optimal growing conditions, where plant growth and development are not limited by factors other than solar radiation and temperature. Ymax is the real yield ceiling, limited by climate, sowing date and varietal choice. In practice, this yield cannot be reached in farmers’ fields, and it would also not be cost-effective to try to do so. From an economical point of view, the maximum attainable yield, Ya is situated in the range 70 and 80% of Ymax. The actual average farmer yield (Yf) is often much lower because of a range of constraints that interfere with the rice crop, i.e. growth-limiting factors, such as lack of water and/or nutrient deficiencies, and growth-reducing factors, such as weed pressure, diseases and pests. With optimal management, best farmer yields (Ybf) can be considerably higher than Yf. Yield gaps between Ymax, Ya , Ybf and Yf can be very important.
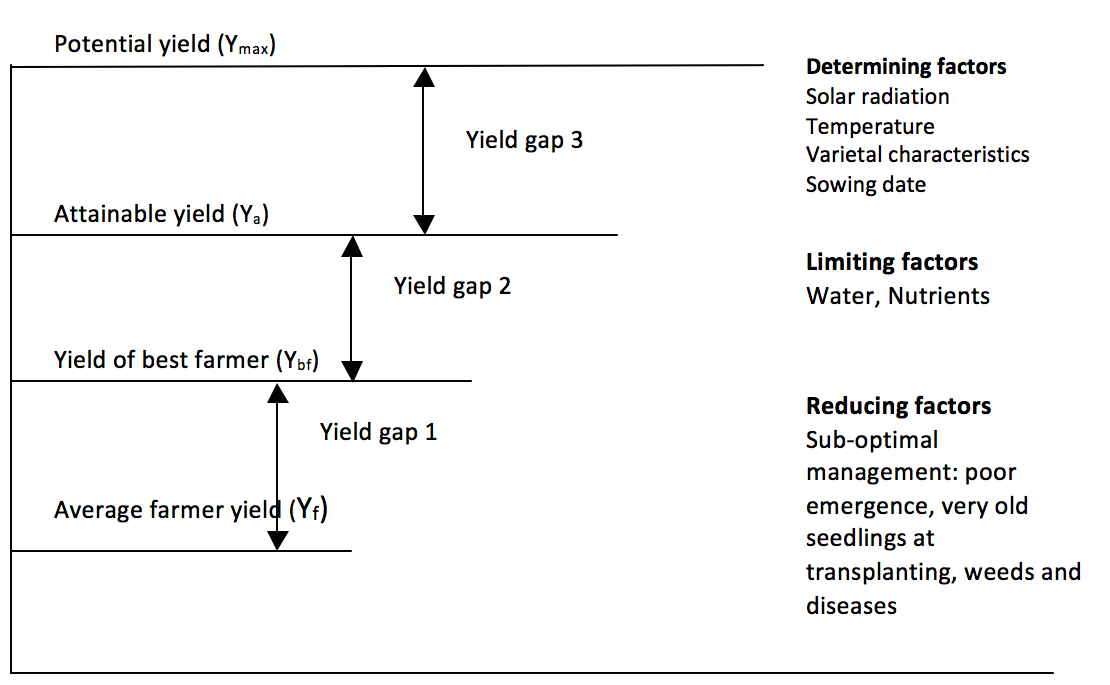
Figure 15.1. Yield gaps between average yield (Yf) in farmers’ fields, the yield of the best farmer (Ybf), attainable yield (Ya) and potential yield (Ymax)
Farmers often achieve far less than Ymax. It is, however, important to choose a realistic target yield. Yield increases of 0.5 or 1 t/ha compared to previously obtained yields are often possible in farmers’ fields. The target yield should not be higher than the attainable yield of 70 to 80% of the potential yield. This is very important as the response of rice to nutrients is not linear from this point onwards, i.e. larger and larger fertilizer quantities are required to obtain the same increase in yield. Targeting high yields is often neither economical nor realistic, especially when water management is not optimal (in such cases, the application of large quantities of fertilizer becomes too risky).
Estimate the capacity of the soil to supply N, P and K
The soil capacity to supply N, P and K nutrients can be estimated through chemical soil analysis, as indicated in Boxes 15.1 to 15.3. However, the relation between these analytical data and crop growth is often poor, especially for N. A more direct method is to determine the soil nutrient-supplying capacity through small, well-managed plots in farmers’ fields that receive adequate quantities of fertilizer nutrients to reach the target yield, minus one nutrient (for instance, without N, P or K). The yield obtained in these plots is considered an indicator of the soil capacity to supply this ‘missing nutrient.’ The principle of these small zero-N, zero-P and zero-K plots is explained in Table 15.1.
Table 15.1 The Principle of zero-N, zero-P, zero-K plots.
| Mini-plots | N | P | K |
|---|---|---|---|
| Plot 0-N, +P, +K | 0 | + | + |
| Plot 0-P, +N, +K | + | 0 | + |
| Plot 0-K, +N, +P | + | + | 0 |
| Plot +N, +P, +K | + | + | + |
|
0 - nutrient is not applied, it is the ‘missing nutrient’; + = nutrient is sufficiently applied so as not to limit crop growth (the exact amount will depend on the growth conditions, one may refer to recommendations currently used by extension staff, or to what is done by the best farmer). |
|||
Figure 15.2 gives an example of the results obtained for these zero-nutrient plots. For the yield target, the soil nutrient-supplying capacity is limiting in the order of N > P > K. For the yield obtained, soil K-supplying capacity is not a limiting factor but N and P are limiting factors, in the order of N > P.
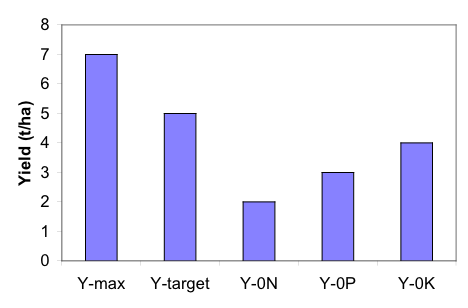
Figure 15.2 Example of yields obtained in zero-nutrient plots, potential yield and target yield.
Y-max = potential yield; Y-target = target yield; Y-0N = yield obtained without N but with adequate doses of P and K; Y-0P = yield obtained without P but with adequate doses of N and K; Y-0K = yield obtained without K but with adequate doses of N and P.
Calculating fertilizer requirements
Nitrogen, P and K rates for rice straw and rice grains are indicated in Table 15.2. Nutrients leave the plot at harvest with the rice grains. Straw is often burned or incorporated into the soil. Using straw has little effect on the soil capacity to supply P or N, but it increases K supply. If the straw is not returned to the field, important quantities of K are lost to the system.
Table 15.2. N, P, K concentrations in rice grains and straw (%).
| N | P2O5 | K2O | |
|---|---|---|---|
| Grain | 1.0 | 0.4 | 0.3 |
| Straw | 0.5 | 0.2 | 1.5 |
Field research in Asia and West Africa has shown that for a yield increase of 1 t/ha and balanced N, P and K nutrition, rice consumes:
- 15 kg N/ha
- 6 kg P2O5/ha
- 18 kg K2O/ha
Nitrogen
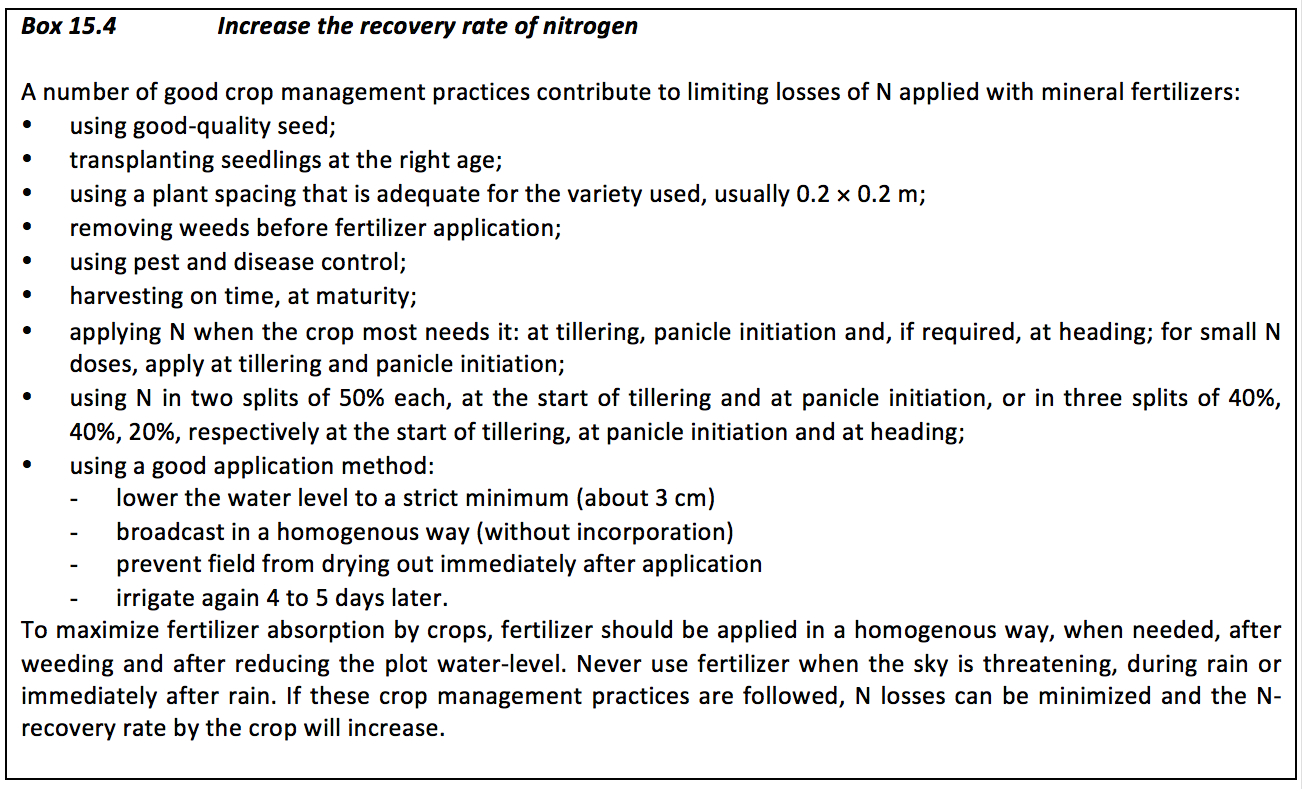
The recovery rate of N in a farmer’s field is on average about 30%. This means that about 70% of N-fertilizer is lost because of many constraints, such as late urea application, weed pressure, seedlings that are too old at transplanting. To obtain a balanced consumption of 15 kg N/ha for a yield increase of 1 t/ha, one has to apply 50 kg N/ha, thus a little more than two bags of urea per hectare. Better field management can increase the recovery rate and diminish fertilizer losses (see Box 15.4). In the example of Figure 15.2, the yield of the 0-N plot is 2 t/ha. To obtain the target yield of 5 t/ha, one should apply 150 kg N/ha.
It is better not to apply more than 50 kg N/ha at one time. The best timing for N application in rice cropping is at the start of tillering (once rice seedlings have recovered from the transplanting shock), at panicle initiation and at heading. For smaller quantities, it is advised to make two applications of 50% each at the start of tillering and at panicle initiation. For larger quantities, it is advised to apply in three splits: at the start of tillering (40%), at panicle initiation (40%) and at heading (20%). Avoid applying fertilizer in deep water (> 5 cm) or in weed-infested plots.
Phosphorus
The recovery rate of phosphorus is on average about 20%. Nevertheless, the phosphorus not absorbed by the crop remains available for the next year. In the first year, for a yield increase of 1 t/ha, about 30 kg P2O5/ha will be required. Figure 15.2 shows that the yield of the 0-P plot is 3 t/ha. The target yield of 5 t/ha can be obtained with an application of 60 kg P2O5/ha. Phosphorus application is preferably done as basally. If not, it should be applied very early to stimulate tillering.
Potassium
The recovery rate of K is on average about 30%. As for phosphorus, the potassium not absorbed during the campaign is (normally) available the next year. To cover the K requirement in the first year, to obtain a yield increase of 1 t/ha, one should apply 60 kg K2O/ha. The example of Figure 15.2 indicates that the yield of the 0-K plot is 4 t/ha. To reach the target yield of 5 t/ha, an application of 60 kg K2O/ha is required.
Potassium can be applied as basal fertilizer or as top-dressing. Low quantities of K can be used at transplanting or as basal fertilizer. It is advisable to apply higher quantities (> 50 kg K2O/ha) as basal fertilizer (50%) and at panicle initiation (50%).
Avoid soil nutrient mining!
The small zero-N, zero-P and zero-K plots are good soil-fertility indicators. It is advisable to use them each year, but not in the same spot. Good management of these mini-plots is essential to ensure that the yields obtained actually express the capacity of the soil to supply the ‘missing nutrient.’ These well-managed mini-plots can become a means of evaluating the evolution of soil fertility in farmers’ fields over time.
Careful! Even if the yields of the small zero-nutrient plots do not indicate the need to apply fertilizer, it is possible that a maintenance application is necessary to prevent soil fertility from being mined over time. Table 15.2 could help estimate the requirements for a maintenance application. For instance, considering Figure 15.2, a target yield of 4 instead of 5 t/ha does not require K application. However, the soil loses a considerable quantity of K, especially when straw is exported from the plot. A grain yield of 4 t/ha is usually equivalent to a straw yield of 4 t/ha. Which means that, with each harvest, the soil looses (Table 15.2) 4000 ´ 0.015 + 4000 ´ 0.003 = 72 kg K2O/ha.
Combining organic amendments and mineral fertilizers is often the best strategy for maintaining or even increasing soil fertility.